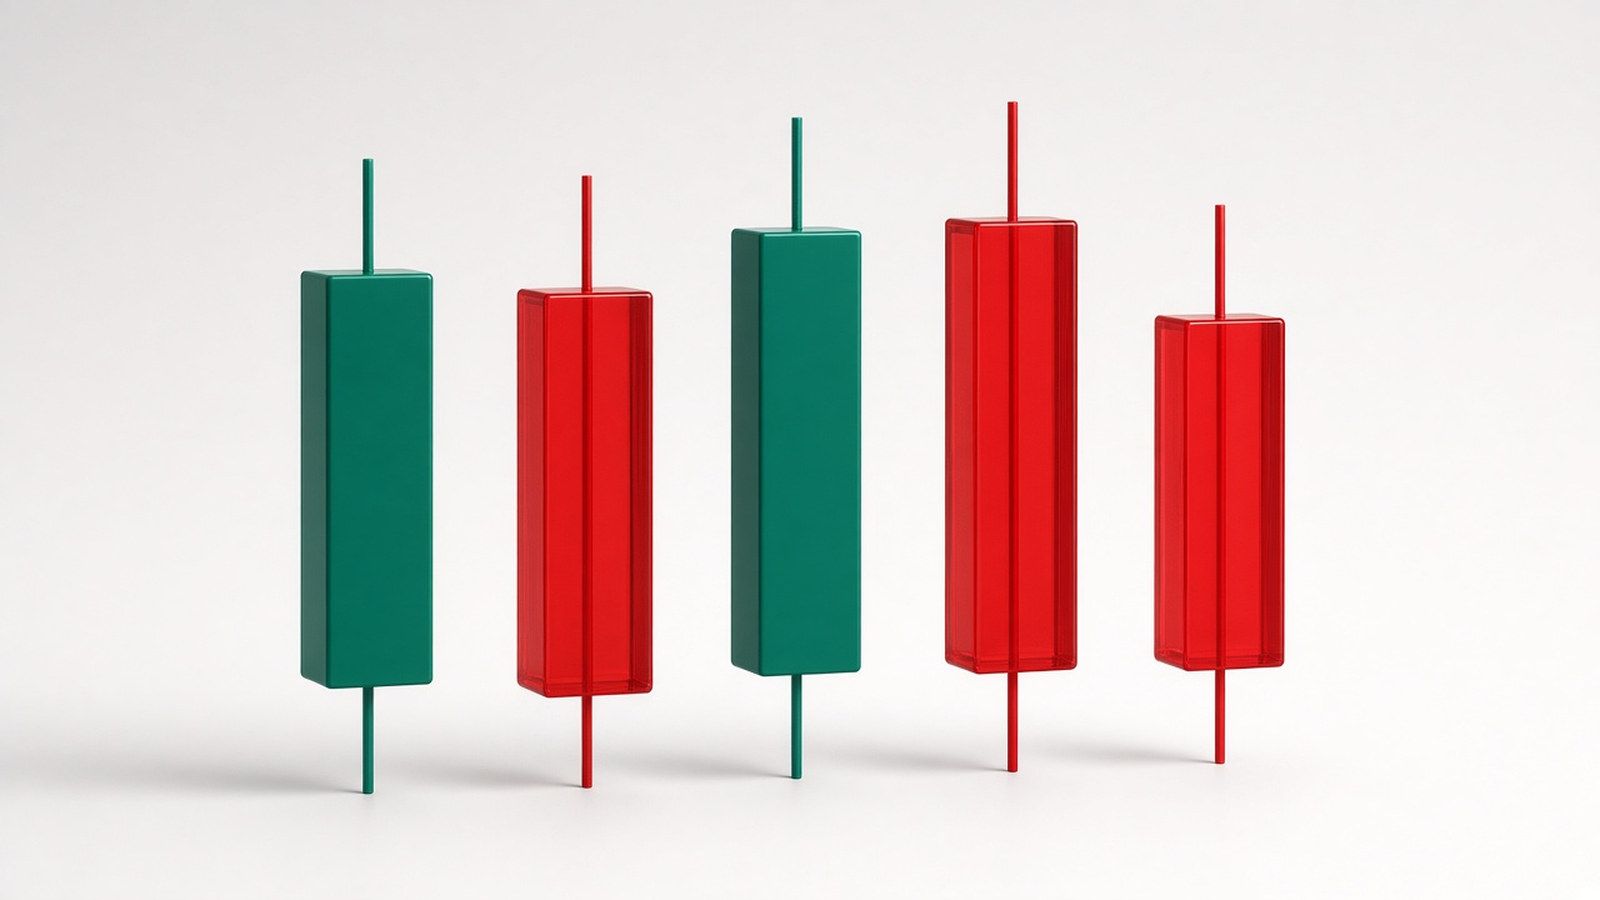
A candle summarises one period with four prices: open, high, low and close (OHLC). The body spans open to close; the wicks (shadows) reach the high and low.
How traders use it: The candle's timeframe matters: a daily candle summarises a day, and a pattern on one timeframe can look different on another.
Common mistake: Forgetting that one candle hides the path inside it. A long wick could have formed at any point in the period.
Related: Candle body · Wick (shadow) · Close significance
See this term in the full glossary · All terms
Concepts only. Education only, not financial advice. No pattern on this site has a published win rate.