Sixteen annotated charts from public daily and 4-hour prices, so you can see what common technical-analysis shapes look like on real candles—including when the next sessions do not play out neatly.
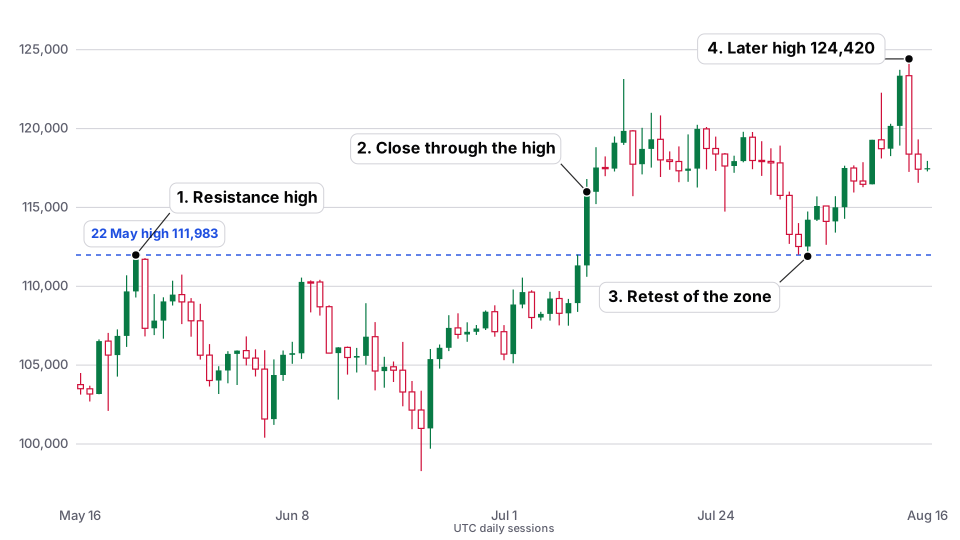
BTC/USD, daily. After a notable high, price later closes through it, then comes back to that zone from above. The question is whether the old ceiling can act as a floor.
BTC/USD daily, 16 May–16 August 2025. Source: Kraken public OHLC API. The dashed line is the 22 May 2025 high of $111,983.20.
What this support/resistance flip example shows
What the setup shows
On 22 May 2025 Bitcoin printed a high of $111,983.20. On 10 July it closed at $115,990.20, through that high. In early August it returned: 1 August low $112,688.10, 2 August low $112,000.00, 3 August low $111,897.10, with that day closing at $114,224.10, back above the May high.
Hypothetical study logic (untested)
A study of this idea might treat the 3 August close of $114,224.10 as interest after the retest, with invalidation below the retest extreme of $111,897.10. Planned risk would be $2,327.00 (1R). An illustrative 2R target would sit at $118,878.10. Those numbers are arithmetic from the daily bar, not a fill, and the parameters are untested.
What price did afterwards
Price later reached $124,420.00 on 14 August (close $118,383.10). By 19 August it had closed at $112,830.30, giving back the follow-through and coming back into the retest zone.
What could go wrong
The 2–3 August lows traded through the exact May high, so a line drawn at $111,983.20 is a zone, not a precise tripwire. A later rally does not keep the level intact: the 19 August close shows how quickly the move can be given back. Daily bars also hide gaps and slippage through a stop.
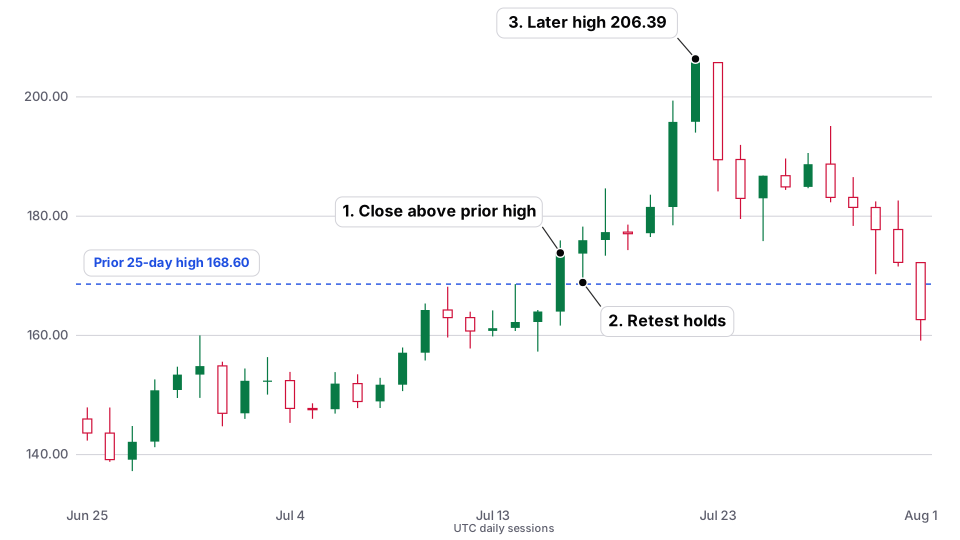
SOL/USD, daily. A classic breakout-and-retest shape: first a close above a clearly marked high, then a pullback that stays above it.
SOL/USD daily, 25 June–1 August 2025. Source: Kraken public OHLC API. The dashed line is the prior 25-day high of $168.60, taken from the 25 sessions before 16 July.
What this breakout and retest example shows
What the setup shows
On 16 July 2025 Solana closed at $173.84, above the prior 25-day high of $168.60. The next day, 17 July, traded down to $168.87 and closed at $175.97, remaining above that prior high.
Hypothetical study logic (untested)
A study might treat the 17 July close of $175.97 as interest after the retest, with invalidation below the 17 July low of $168.87. Planned risk would be $7.10 (1R). An illustrative 2R target would sit at $190.17. Untested, and the fill is not known from a daily bar.
What price did afterwards
In the next eight sessions (18–25 July) the high was $206.39 on 22 July and the low was $173.36, which stayed above the 17 July low. The 25 July close was $186.78.
What could go wrong
A retest can fail and close back under the breakout level, or a wick can take out the stop before a later high prints. A handful of stronger sessions after one retest is not a sample and is not an edge.
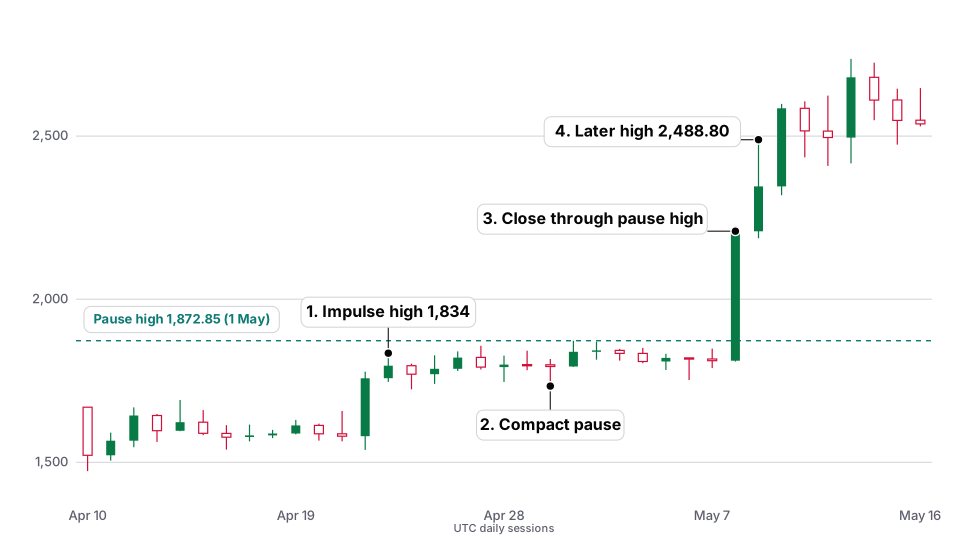
ETH/USD, daily. After a sharp advance, price spent about two weeks moving in a relatively compact range, then closed through that range high. This is a bull-flag-like pause, not a perfectly downward-sloping channel tucked under a single high.
ETH/USD daily, 10 April–16 May 2025. Source: Kraken public OHLC API. The dashed line is the 1 May high of $1,872.85, the highest close-to-close pause high before 8 May.
What this bull-flag example shows
What the setup shows
From 21–23 April 2025 Ether advanced from a 21 April low of $1,564.32 to a 23 April high of $1,834.44, closing that day at $1,796.05. Over 24 April–7 May it paused: the 24 April low was $1,723.73 and the 1 May high was $1,872.85, slightly above the 23 April high, so the pause was not a textbook flag under a fixed ceiling. On 8 May it closed at $2,208.36, through the pause high.
Hypothetical study logic (untested)
Daily bars cannot show a precise breakout fill. A study of this shape might only take interest if price traded through $1,872.85, with invalidation below the 6 May pullback low of $1,752.41 (or the deeper 24 April low of $1,723.73). From a hypothetical break at $1,872.85 down to $1,752.41, 1R would be $120.44 and 2R would sit at $2,113.73. Those distances are wide, and the parameters are untested.
What price did afterwards
The 8 May close was already $2,208.36, above that illustrative 2R figure. On 9 May the high was $2,488.80 (close $2,345.79). That is a description of later prices, not a filled study order.
What could go wrong
Pauses often break the wrong way. A “flag” whose highs already exceeded the impulse high is a looser structure than the textbook drawing. A close far beyond the breakout level also means a market order at the close would have paid up, shrinking any planned R.
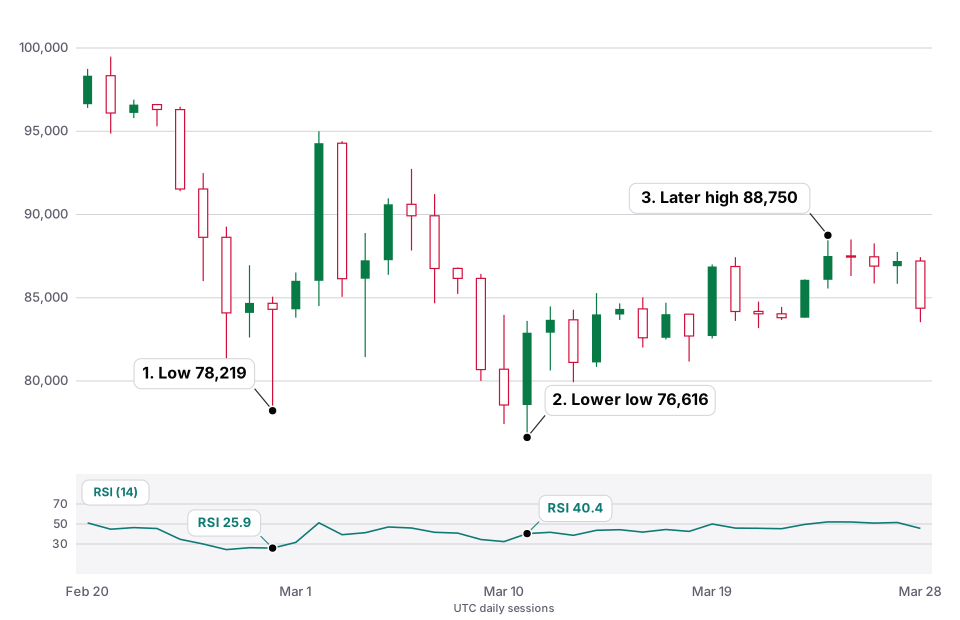
BTC/USD, daily. Bullish regular divergence between price and a 14-period RSI (Wilder smoothing) calculated from these daily closes. Divergence is a description of disagreement, not an entry by itself.
BTC/USD daily, 20 February–28 March 2025. Source: Kraken public OHLC API. RSI(14) is calculated from these Kraken daily closes using Wilder smoothing; it is not a vendor overlay.
What this RSI divergence example shows
What the setup shows
On 28 February 2025 Bitcoin’s low was $78,219.00 and RSI(14) was 25.9. On 11 March the low was lower, at $76,615.70, while RSI was higher, at 40.4. That 11 March bar closed at $82,900.00.
Hypothetical study logic (untested)
This picture is for reading the divergence, not a complete rule. A tightly written, still-untested study might wait for a close back above the 28 February close of $84,309.20, and treat a break of the 11 March low of $76,615.70 as invalidation. From $84,309.20 that stop is $7,693.50 wide (1R), which is a large risk relative to the later swing and a reason not to treat the shape as a ready-made trigger.
What price did afterwards
The path was not a straight run: 13 March still printed a low of $79,930.70. Price later reached $88,750.00 on 24 March (close $87,505.30), then faded to a 31 March close of $82,523.00.
What could go wrong
Divergence can persist while price keeps falling. RSI settings change the picture. A wide invalidation can still be hit, and a later high does not mean a trader would have been in, or stayed in, with a defined rule.
05 / Moving-average crossover and trend pullback
A pullback to the 20-day average — and a stop that would have been hit
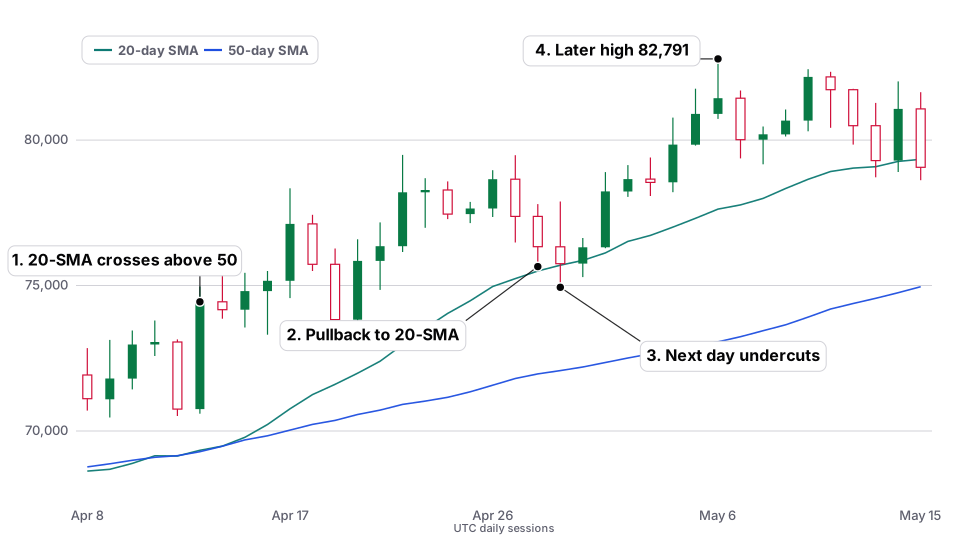
BTC/USD, daily. After the 20-day simple moving average crossed above the 50-day, price later tagged the 20-day line. This example is included because the very next session undercut that pullback low.
BTC/USD daily, 8 April–15 May 2026. Source: Kraken public OHLC API. Teal line: 20-day SMA. Blue line: 50-day SMA, both calculated from these Kraken daily closes.
What this moving-average pullback example shows
What the setup shows
On 13 April 2026 the 20-day SMA ($69,338.69) crossed above the 50-day SMA ($69,287.89); the close was $74,441.70. On 28 April price pulled back: low $75,652.10, close $76,331.90, with the 20-day SMA at $75,500.18 and the 50-day at $71,962.07. The low held above the 20-day average that day.
Hypothetical study logic (untested)
A study of a “buy the first hold of the 20-day SMA after a bullish 20/50 cross” might treat the 28 April close of $76,331.90 as interest, with invalidation below that day’s low of $75,652.10. Planned risk would be $679.80 (1R). An illustrative 2R target would sit at $77,691.50. Untested.
What price did afterwards
The next session, 29 April, traded down to $74,940.00 and closed at $75,750.30 — through the 28 April low, so that untested stop would have been hit. Price later reached $82,790.90 on 6 May (close $81,438.00). A later high is not a recovered trade if the stop was already hit.
What could go wrong
Exactly this: a tidy tag of the average can be followed immediately by a deeper undercut. Moving-average length is an untested choice. Seeing a later high without also recording the stop-out would be cherry-picking.
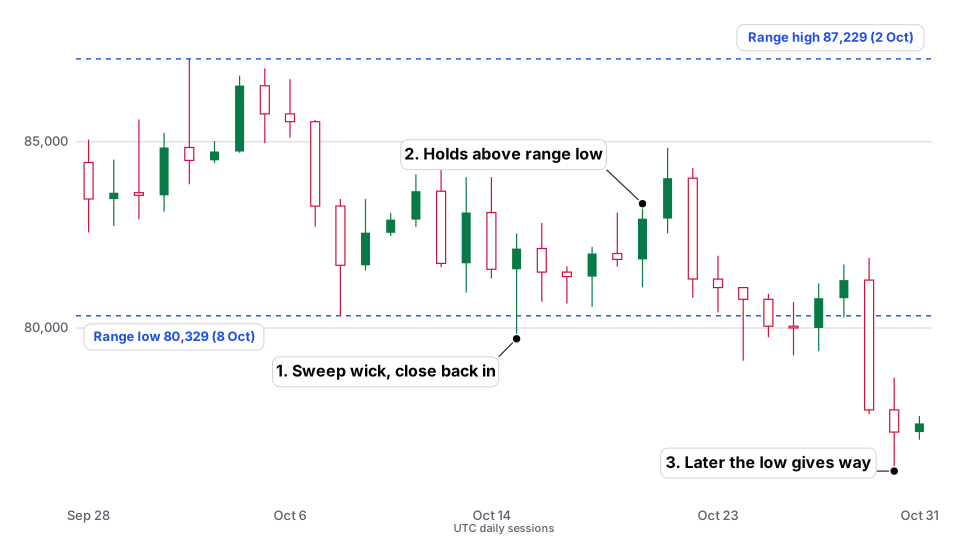
BTC/USD, daily. Price poked through a recently established range low and closed back inside — the same shape as the hand-drawn sweep illustrations — and then, days later, the low gave way. This is the example that does not “work” as a lasting long.
BTC/USD daily, 28 September–31 October 2026. Source: Kraken public OHLC API. Range taken from 1–14 October 2026: high $87,229.00 on 2 October, low $80,328.60 on 8 October.
What this range sweep example shows
What the setup shows
From 1–14 October 2026 Bitcoin’s range high was $87,229.00 (2 October) and the range low was $80,328.60 (8 October). On 15 October it traded down to $79,709.00, through that low, and closed at $82,133.70, back inside the range.
Hypothetical study logic (untested)
A study of a reclaim might treat the 15 October close of $82,133.70 as interest, with invalidation below the sweep low of $79,709.00. Planned risk would be $2,424.70 (1R). An illustrative 2R target would sit at $86,983.10, just under the range high. Untested, and a daily close is not a known fill.
What price did afterwards
Over the next five sessions the high was $83,339.10 on 20 October and the low was $80,567.90 on 18 October, still above the range low, and short of the 2R figure. On 24 October the low was $79,120.80, under the 15 October sweep low. On 30 October the low was $76,155.50 (close $77,204.30).
What could go wrong
The reclaim can be temporary. A stop under the sweep wick would have been hit on 24 October, and price then moved further against the idea. A few sessions that “hold” after a sweep are not evidence the pattern has an edge.
07 / Change of character and break of structure
A higher-high sequence, then a close under the last higher low
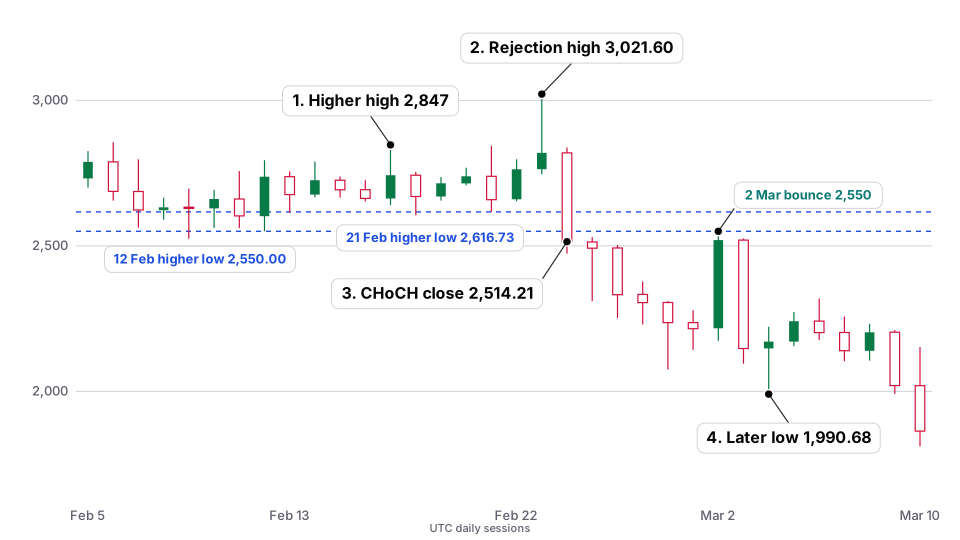
ETH/USD, daily. After a short run of higher highs and higher lows, a rejection high is followed by a close under the last higher low — a change of character — and then a further break of structure.
ETH/USD daily, 5 February–10 March 2025. The dashed lines are the 12 February low of $2,550.00 and the 21 February low of $2,616.73. Source: Kraken public OHLC API.
What this Change of character and break of structure example shows
What the setup shows
From 9–23 February 2025 Ether made higher lows (9 February $2,524.70, 12 February $2,550.00, 18 February $2,605.12, 21 February $2,616.73) and higher highs (17 February $2,847.00, then 23 February $3,021.60). The 23 February session had a long upper wick: high $3,021.60, close $2,819.49, with the upper wick about 73% of the day’s range. On 24 February it opened at $2,819.49, traded down to $2,473.34, and closed at $2,514.21 — under the 21 February higher low of $2,616.73. On 25 February the low was $2,309.99 (close $2,491.74), a further break of structure.
Hypothetical study logic (untested)
A study of a CHoCH short might treat the 24 February close of $2,514.21 as interest, with invalidation above that day’s high of $2,838.33. Planned risk would be $324.12 (1R). An illustrative 2R target would sit at $1,865.97. A wider stop above the 23 February high of $3,021.60 would be $507.39 of planned risk. Untested, and a daily close is not a known fill.
What price did afterwards
On 2 March price bounced: high $2,550.00, close $2,519.77, still below the 24 February high. On 3 March it sold off again (low $2,095.00, close $2,147.28). The 4 March low was $1,990.68, short of the tighter 2R figure. On 10 March the low was $1,810.66 and the close was $1,863.51, through that 2R figure on the low, just under it on the close.
What could go wrong
The 2 March bounce to $2,550.00 would have been an uncomfortable move against a short that was still inside the untested stop. A change of character is a description of a close under a prior higher low, not a promise of a trend change. Daily bars also hide gaps and slippage through a stop.
08 / Liquidity sweep of equal highs
Nearly equal highs, a sweep, then a close back below
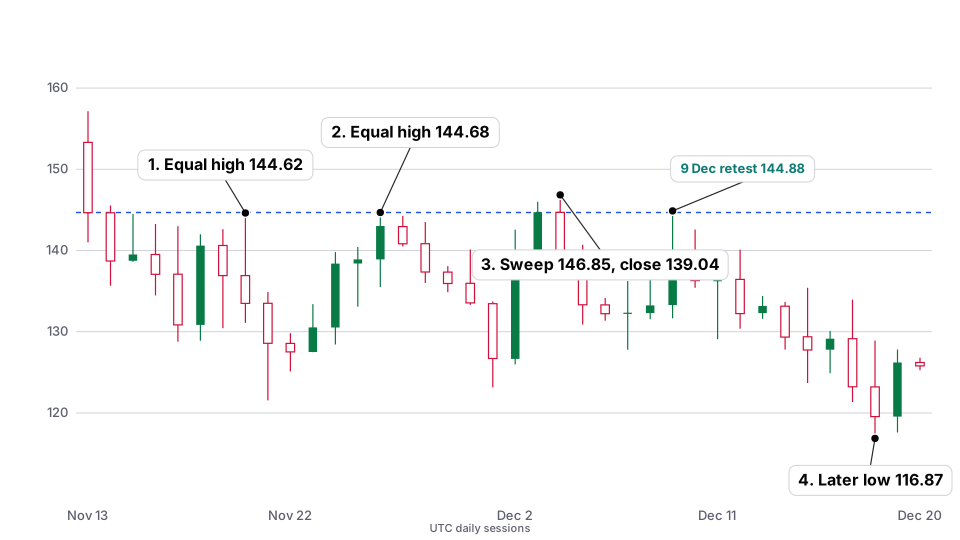
SOL/USD, daily. Two bounce highs printed almost the same price, a later session traded through them, and that session closed back below. This is the sweep shape, including an earlier probe that already traded through the equals.
SOL/USD daily, 13 November–20 December 2025. The dashed line is the 26 November high of $144.68, six cents above the 20 November high of $144.62. Source: Kraken public OHLC API.
What this Liquidity sweep of equal highs example shows
What the setup shows
On 20 November 2025 Solana’s high was $144.62; on 26 November it was $144.68, six cents apart. On 3 December, before the more decisive session, the high was already $146.00, through those equals, and the close was $144.72, back at the zone. On 4 December the high was $146.85 and the close was $139.04, further below the equals.
Hypothetical study logic (untested)
A study of a sweep short might treat the 4 December close of $139.04 as interest, with invalidation above the 4 December high of $146.85. Planned risk would be $7.81 (1R). An illustrative 2R target would sit at $123.42. Untested, and a daily close is not a known fill. The 3 December probe to $146.00 is part of the picture: the equals had already been traded through once.
What price did afterwards
On 9 December the high was $144.88, a retest that did not exceed the 4 December sweep high, and the close was $137.88. On 18 December the low was $116.87 (close $119.55), through the 2R figure.
What could go wrong
A sweep close is not a reversal by itself. The 3 December session already traded through the equals and closed back at them, so a rule that “the first sweep is the trade” would have had to decide what to do a day earlier. A later low does not mean a trader would have been in, or stayed in, with a defined rule.
09 / Fair value gap (partial fill)
A displacement gap that was only partly filled, then held
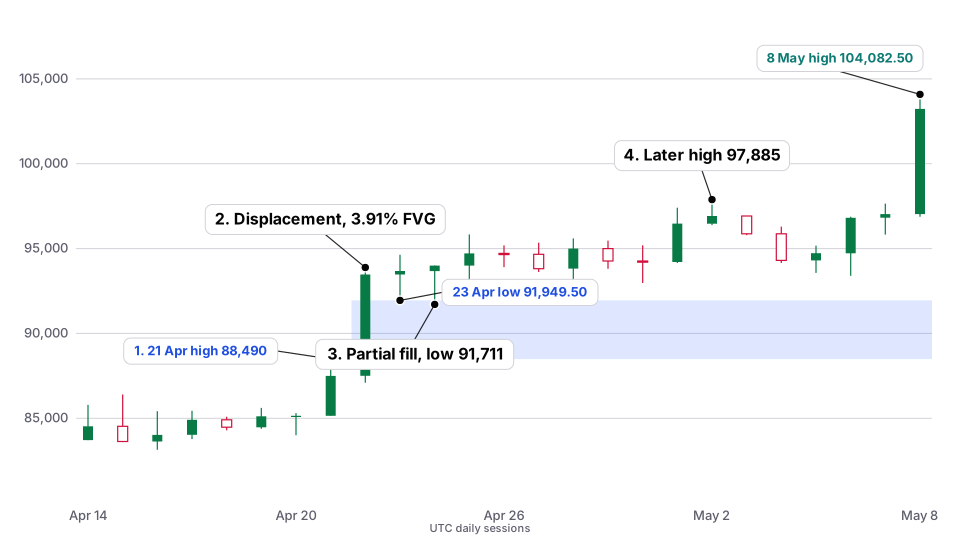
BTC/USD, daily. A three-candle fair value gap opened on a strong up session. The next session traded a short way into the gap and closed back out — a partial fill, not a full fill.
BTC/USD daily, 14 April–8 May 2025. The shaded band is the gap between the 21 April high of $88,490.00 and the 23 April low of $91,949.50. Source: Kraken public OHLC API.
What this Fair value gap, partial fill example shows
What the setup shows
On 21 April 2025 Bitcoin’s high was $88,490.00 (close $87,500.60). On 22 April a displacement session opened at $87,500.70, traded $93,888.00 / $87,100.00, and closed at $93,472.00. On 23 April the low was $91,949.50, leaving a gap of $3,459.50 between the 21 April high and the 23 April low — 3.91% measured from $88,490.00. On 24 April the low was $91,711.00, $238.50 into that gap, and the close was $93,999.90, back above the gap.
Hypothetical study logic (untested)
A study of a “buy a hold after a partial fill” might treat the 24 April close of $93,999.90 as interest, with invalidation below that day’s low of $91,711.00. Planned risk would be $2,288.90 (1R). An illustrative 2R target would sit at $98,577.70. Untested, and a daily close is not a known fill. This is a partial fill only: $238.50 into a $3,459.50 gap, not a complete retrace to the 21 April high.
What price did afterwards
After 24 April, later lows in this window stayed at or above $92,900.00 (25 April and 28 April), which is already above the top of the gap at $91,949.50 — so the gap was not filled any further. The 2 May high was $97,885.00, short of the 2R figure. The 8 May high was $104,082.50 (close $103,228.00), through that 2R figure.
What could go wrong
Gaps can be filled completely, or price can fail to hold the partial fill and continue through the zone. Calling this a “held FVG” after the fact describes what these sessions did; it is not evidence the shape has an edge. A close far from the fill also means a market order at the close would have paid up.
10 / Order block / demand zone
The last down candle before a displacement, then a return
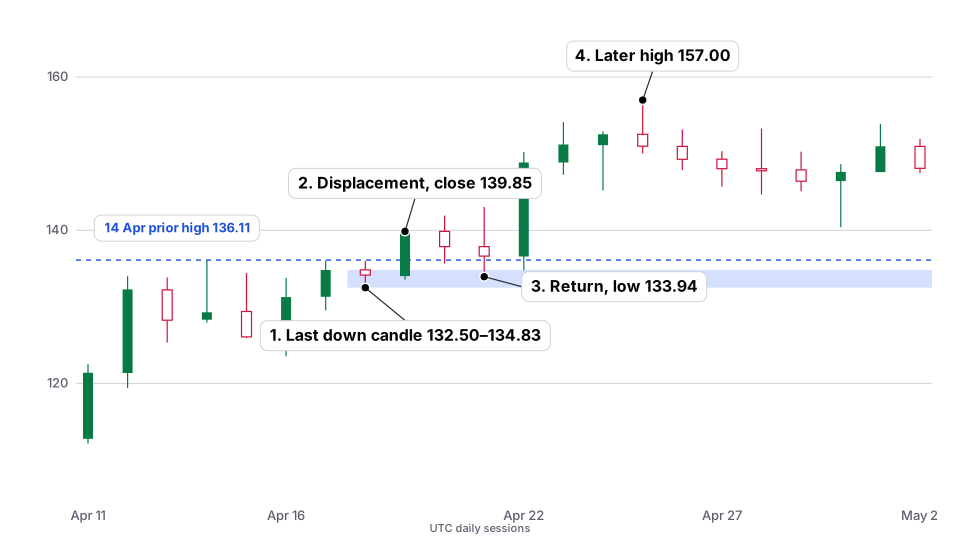
SOL/USD, daily. The last down candle before a bullish displacement is marked as a demand zone. Price later came back into that zone and then moved up. The displacement candle itself already wicked into the zone.
SOL/USD daily, 11 April–2 May 2025. The shaded band is the 18 April down-candle range of $132.50–$134.83. The dashed line is the 14 April high of $136.11. Source: Kraken public OHLC API.
What this Order block and demand zone example shows
What the setup shows
On 18 April 2025 Solana printed the last down candle before the impulse: open $134.83, high $135.99, low $132.50, close $134.15, a zone of $132.50–$134.83. On 19 April a displacement session opened at $134.01, wicked to $133.56 (already inside that zone), and closed at $139.85, through the 14 April prior high of $136.11. On 21 April price returned: low $133.94, still inside the zone, close $136.63.
Hypothetical study logic (untested)
A study of a demand-zone return might treat the 21 April close of $136.63 as interest, with invalidation below the 18 April zone low of $132.50. Planned risk would be $4.13 (1R). An illustrative 2R target would sit at $144.89. Untested, and a daily close is not a known fill. The 19 April displacement low of $133.56 had already tagged the zone on the impulse day itself.
What price did afterwards
On 22 April the low was $134.79, still above the zone low, and the close was $148.85, already through the 2R figure. The 25 April high was $157.00 (close $150.98). In the rest of this window, later lows stayed above $132.50; the 30 April low was $140.40.
What could go wrong
A return to a marked zone can fail and close through the low. Zones are areas, not precise tripwires. A close already through a 2R figure on the next session also means a market order at the 21 April close would have captured only part of the later range, and only if a fill existed at that close.
11 / Evening star
A three-candle evening star, then a later decline — and a bounce
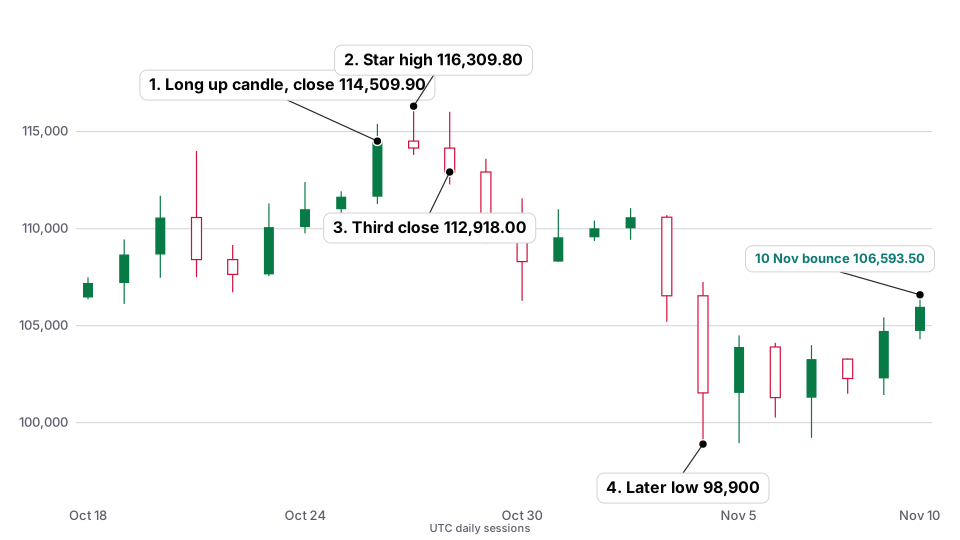
BTC/USD, daily. A long up candle, a small-bodied star with a long upper wick, and a third candle whose close sits just under the first candle’s midpoint. The pattern is close to the textbook drawing, not a perfect copy of it.
BTC/USD daily, 18 October–10 November 2025. This window starts after the 10 October session, which is not shown. Source: Kraken public OHLC API.
What this Evening star at a local high example shows
What the setup shows
On 26 October 2025 Bitcoin opened at $111,645.20, high $115,400.00, low $111,274.30, close $114,509.90. The midpoint of that body is $113,077.55. On 27 October the star opened at $114,510.00, high $116,309.80, low $113,801.40, close $114,153.00. The body is 0.31% of the open, and the upper wick is about 72% of the day’s range. On 28 October it opened at $114,153.10, wicked up to $116,023.40 (near the star high), and closed at $112,918.00 — just under the first candle’s midpoint of $113,077.55, by $159.55.
Hypothetical study logic (untested)
A study of an evening-star short might treat the 28 October close of $112,918.00 as interest, with invalidation above the star high of $116,309.80. Planned risk would be $3,391.80 (1R). An illustrative 2R target would sit at $106,134.40. Untested, and a daily close is not a known fill. The third close only just undercuts the first-body midpoint, and that same session wicked back to $116,023.40.
What price did afterwards
On 4 November the low was $98,900.00 (close $101,537.30), through the 2R figure. Price then bounced: the 10 November high was $106,593.50 (close $105,973.30), back through that 2R figure, but still well under the 27 October star high of $116,309.80.
What could go wrong
The third candle’s wick to $116,023.40 came close to the untested stop at $116,309.80. A slightly longer wick would have tagged it. A later bounce can give back a large part of the decline, as 10 November shows. An evening star is a three-candle description, not a complete trade rule.
12 / Head and shoulders
Two similar shoulders around a higher head, then a close through the neck
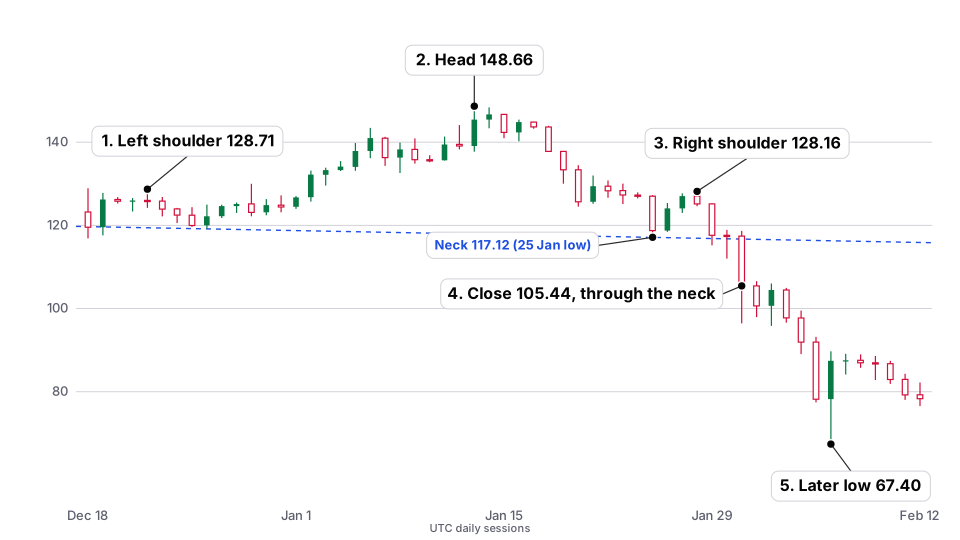
SOL/USD, daily. A left shoulder, a higher head, a right shoulder close in price to the left, and a close through a slightly sloped neckline. The left shoulder is brief, and an intermediate high sits on the way to the head.
SOL/USD daily, 18 December 2025–12 February 2026. The dashed neckline runs through the 26 December low of $119.16 and the 25 January low of $117.12. Source: Kraken public OHLC API.
What this Head and shoulders example shows
What the setup shows
On 22 December 2025 Solana’s high was $128.71, a brief left-shoulder peak. On 26 December the low was $119.16. On the way to the head, 29 December printed a slightly higher $130.00. The head high was $148.66 on 13 January 2026 (a 6 January high of $143.43 sits on that rise). The right neck trough was $117.12 on 25 January. The right shoulder high was $128.16 on 28 January, close to the 22 December high. On 29 January the low was $115.21, already through the 25 January neck low, with a close of $117.62 back at the neck. On 31 January the low was $96.43 and the close was $105.44, clearly through the neck.
Hypothetical study logic (untested)
A study of a neckline break might treat the 31 January close of $105.44 as interest, with invalidation above that day’s high of $118.67. Planned risk would be $13.23 (1R). An illustrative 2R target would sit at $78.98. A wider stop above the right-shoulder high of $128.16 would be $22.72 of planned risk, with 2R at $60.00. Untested. The 31 January close is already $11.68 under the 25 January neck low, so a market order at that close would have paid a large part of the move.
What price did afterwards
On 6 February the low was $67.40 (close $87.42), through the tighter 2R figure of $78.98, and short of the wider 2R figure of $60.00.
What could go wrong
The left shoulder is a brief peak, and 29 December’s $130.00 high is slightly above it, so this is a looser structure than a textbook drawing with two clean, equal shoulders. The 29 January wick to $115.21 had already traded through the neck a session before the 31 January close. A later low after a close far beyond the neck is not a filled study order at the neck itself.
13 / Multi-timeframe alignment (daily and 4-hour)
A daily double bottom, then a 4-hour close through the neck
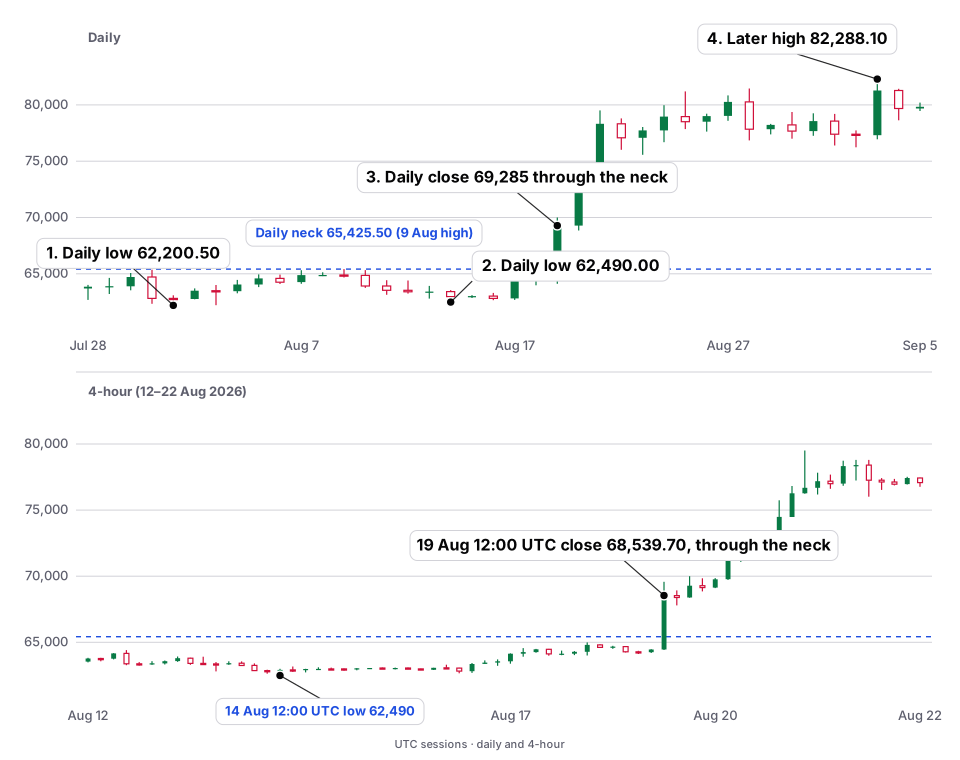
BTC/USD, daily and 4-hour. Two similar daily lows, a neck at a daily high between them, and a 4-hour session that closed through that neck on the same day the daily bar closed through it. Both timeframes are shown because the alignment is the point of the example.
BTC/USD, daily 28 July–5 September 2026 (upper pane) and 4-hour 12–22 August 2026 (lower pane). The dashed line is the 9 August daily high of $65,425.50. All times are UTC. Source: Kraken public OHLC API.
What this Multi-timeframe alignment, daily double bottom example shows
What the setup shows
On 1 August 2026 Bitcoin’s daily low was $62,200.50; on 14 August it was $62,490.00, $289.50 apart. Between those lows, the 9 August high was $65,425.50, used here as a neck. On 17 August the daily high was $64,562.30 and on 18 August it was $64,995.20, both still below the neck (18 August low $63,985.70, close $64,677.20). On 19 August the daily bar opened at $64,677.20, high $70,001.80, low $64,115.90, close $69,285.00, through the neck. On the 4-hour chart, the 14 August 12:00 UTC bar printed the $62,490.00 low. The 19 August 12:00 UTC bar opened at $64,456.40, high $69,577.20, low $64,421.70, and closed at $68,539.70, through the same $65,425.50 neck.
Hypothetical study logic (untested)
Daily and 4-hour closes are not known fills. A study that waited for the 19 August daily close of $69,285.00 would already be $3,859.50 above the neck. From that close, invalidation below the 14 August low of $62,490.00 is $6,795.00 of planned risk (1R), and an illustrative 2R target would sit at $82,875.00. A tighter untested stop below the 18 August low of $63,985.70 would be $5,299.30 of planned risk, with 2R at $79,883.60. The 19 August 12:00 UTC 4-hour bar itself already ran from an open of $64,456.40 to a close of $68,539.70. Untested.
What price did afterwards
The 28 August high was $81,461.00 (close $77,841.80). The 3 September high was $82,288.10 (close $81,276.10). That 3 September high is short of the wider 2R figure of $82,875.00, and through the tighter 2R figure of $79,883.60. A later high is a description of price, not a filled study order.
What could go wrong
A double bottom is two similar lows, not a guarantee. The two lows here differ by $289.50, and the neck is a single session’s high, not a tested ceiling. Most of the 19 August advance happened inside that daily bar, so a rule that enters on the daily close would have paid up. Alignment on two timeframes is a reading of the same sessions, not evidence of an edge.
14 / Failed breakout — this one did not hold
A close through a March high, then a stop that would have been hit
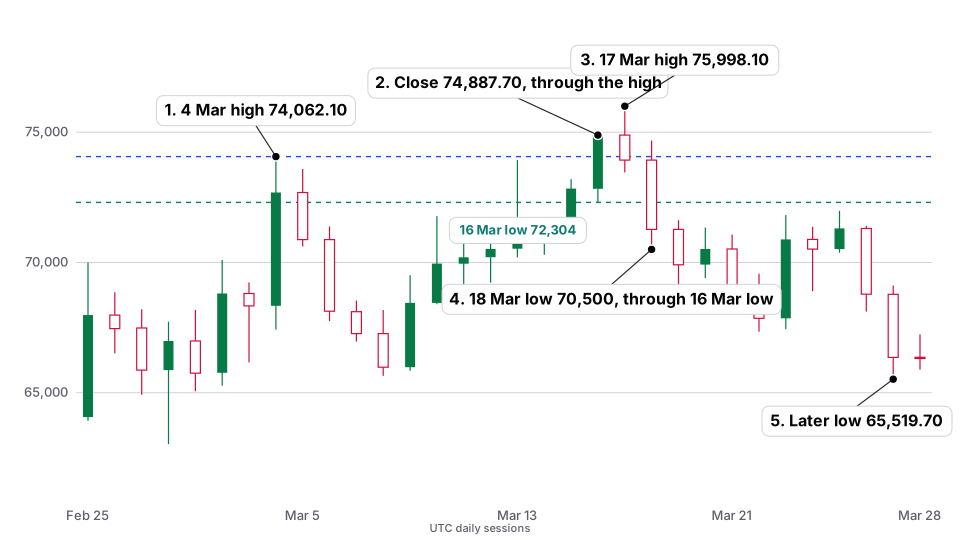
BTC/USD, daily. Price closed through a clearly marked swing high, then the very next sessions gave the breakout back and undercut the breakout day’s low. This is the example of a breakout that does not hold.
BTC/USD daily, 25 February–28 March 2026. The blue dashed line is the 4 March high of $74,062.10. The teal dashed line is the 16 March low of $72,304.00, the untested invalidation in the study logic below. Source: Kraken public OHLC API.
What this Failed breakout above a swing high example shows
What the setup shows
On 4 March 2026 Bitcoin’s high was $74,062.10 (close $72,684.80). A nearby 13 March high was $73,928.50. On 16 March it closed at $74,887.70, through the 4 March high, after a low that day of $72,304.00 (high $74,901.30). On 17 March the high was $75,998.10 and the close was $73,929.90, already back below the 4 March high. On 18 March the low was $70,500.00 (close $71,270.90), through the 16 March low.
Hypothetical study logic (untested)
A study of a “buy a close through the 4 March high” might treat the 16 March close of $74,887.70 as interest, with invalidation below that day’s low of $72,304.00. Planned risk would be $2,583.70 (1R). An illustrative 2R target would sit at $80,055.10. Untested, and a daily close is not a known fill.
What price did afterwards
The 17 March high of $75,998.10 was $1,110.40 above the 16 March close, about 0.43R, and that session already closed back at $73,929.90. On 18 March the low of $70,500.00 undercut the untested $72,304.00 stop. The 2R figure of $80,055.10 was not reached in this window. On 27 March the low was $65,519.70 (close $66,358.30).
What could go wrong
Exactly this: a close through a swing high can fail immediately. The 17 March close back under the 4 March high was already a warning, and the 18 March low would have hit a stop under the 16 March low. Seeing only the 17 March high without also recording the stop-out would be cherry-picking. A single failed breakout is not a sample and is not an edge for fading breakouts either.
15 / Inside-bar breakout
Several inside bars, a wick through the mother low, then a close through the high
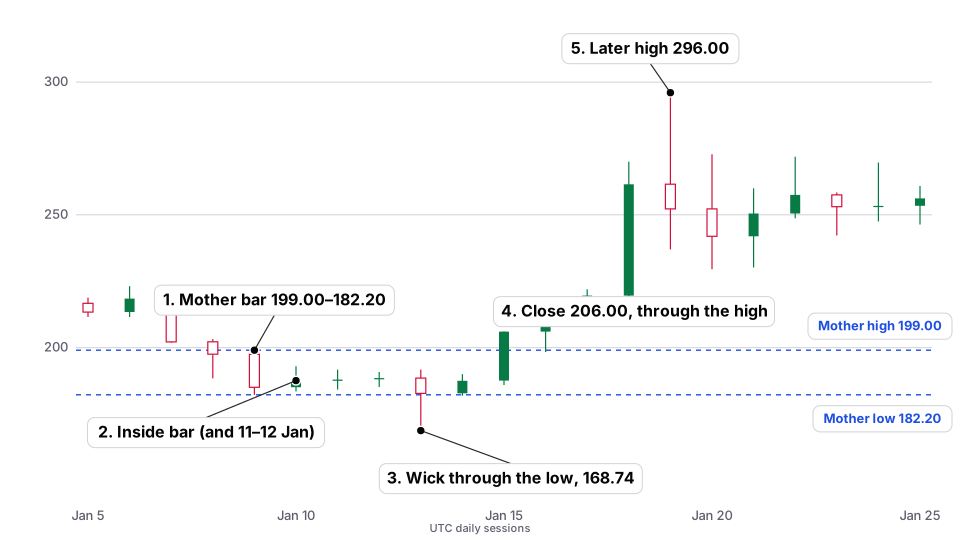
SOL/USD, daily. A wide mother bar is followed by three inside sessions. The first excursion is a wick through the mother low, with a close that still holds above it; the close through the mother high comes two sessions later.
SOL/USD daily, 5–25 January 2025. The dashed lines are the 9 January mother-bar high of $199.00 and low of $182.20. Source: Kraken public OHLC API.
What this Inside-bar breakout, after a downside wick example shows
What the setup shows
On 9 January 2025 Solana printed a wide down candle: open $197.48, high $199.00, low $182.20, close $185.06. The next three sessions were inside that mother range: 10 January high $192.97 / low $183.46, 11 January $191.69 / $184.17, and 12 January $190.79 / $185.16. On 13 January the low was $168.74, through the mother low of $182.20, and the close was $182.73, still just above it. On 14 January the low was $181.83, slightly under the mother low, close $187.49. On 15 January the close was $206.00 (high $206.00), through the mother high of $199.00.
Hypothetical study logic (untested)
A study of an upside inside-bar break might treat the 15 January close of $206.00 as interest. Invalidation below the 13 January wick of $168.74 would be $37.26 of planned risk (1R), with an illustrative 2R at $280.52 — a wide stop. A tighter untested stop below the mother low of $182.20 would be $23.80 of planned risk, with 2R at $253.60. Untested, and a daily close is not a known fill. The 13 January downside wick happened before this hypothetical entry.
What price did afterwards
On 18 January the high was $270.00 (close $261.51), already through the tighter 2R figure. On 19 January the high was $296.00 (close $252.22), through the wider 2R figure of $280.52 as well.
What could go wrong
This is not a single neat inside bar with an immediate close-break. Three inside sessions, then a wick through the mother low, then a close through the high two days later, is a messier sequence than the textbook drawing. A rule that takes the first close outside the mother bar would have had to decide what the 13 January close of $182.73, still above the mother low, counted as. A later high is not proof the shape has an edge.
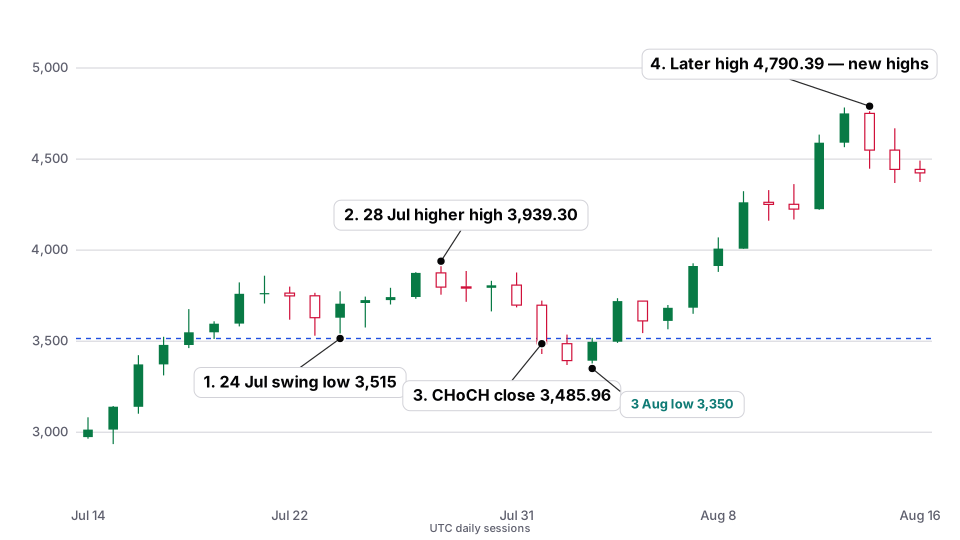
ETH/USD, daily. The same CHoCH idea as example 07: a close under a recent swing low after a higher high. In this window that close is in a short pullback inside a steep advance, and price then made new highs. A single close under a nearby low is not a reversal by itself.
ETH/USD daily, 14 July–16 August 2025. The dashed line is the 24 July low of $3,515.00. This is a short pullback in a steep advance, not a long-established higher-low series. Source: Kraken public OHLC API.
What this Change of character that failed example shows
What the setup shows
Ether had already advanced from a 14 July low of $2,964.59 to a 21 July high of $3,859.67. On 24 July the low was $3,515.00 (close $3,706.09), a swing low after that rise. On 28 July the high was $3,939.30, a new higher high (close $3,797.08). On 1 August it opened at $3,697.68, low $3,429.88, and closed at $3,485.96, under the 24 July low of $3,515.00. The 3 August low was $3,350.00 (close $3,496.80).
Hypothetical study logic (untested)
A study of a CHoCH short might treat the 1 August close of $3,485.96 as interest, with invalidation above that day’s high of $3,722.99. Planned risk would be $237.03 (1R). An illustrative 2R target would sit at $3,011.90. A wider stop above the 28 July high of $3,939.30 would be $453.34 of planned risk. Untested, and a daily close is not a known fill. The “higher low” here is a short pullback in a steep advance, not a long-established series.
What price did afterwards
On 4 August the high was $3,736.10 (close $3,719.99), already through the tighter untested stop of $3,722.99, on the third session after the close. On 8 August the high was $4,070.00 (close $4,008.37), through the wider 28 July high as well. The 14 August high was $4,790.39 (close $4,549.29). The 2R figure of $3,011.90 was not reached. A later high is not a recovered short if the stop was already hit.
What could go wrong
Exactly this: a close under a nearby swing low, especially a short pullback in a strong advance, can be followed by new highs. Example 07 and this example use the same CHoCH idea and two different outcomes. Neither is a sample, and neither is evidence the idea has — or lacks — an edge. Treating one close as a reversal without a defined invalidation would have left a short open into a move to $4,790.39.
Each example also has its own page, with a bar-by-bar stepper when JavaScript is available. The static chart remains the picture if it is not.
Join the lab list
Occasional notes about this public lab — new pages and implementation notes. Not signals, not a membership account, and not an application.
Education only, not financial advice. This is a personal record of one trader’s decisions, including the mistakes. Trading crypto carries a real risk of losing money. Full disclaimer.