12 / Head and shoulders
Two similar shoulders around a higher head, then a close through the neck
SOL/USD, daily. A left shoulder, a higher head, a right shoulder close in price to the left, and a close through a slightly sloped neckline. The left shoulder is brief, and an intermediate high sits on the way to the head.
Educational examples — not a trade Josh took, not a signal

SOL/USD · daily · 2025-12-18 to 2026-02-12. Data: Kraken public OHLC API. Fills, fees and slippage are not known from these bars. Hypothetical study figures on this page are untested.
Related glossary: market structure, key level, break of structure.
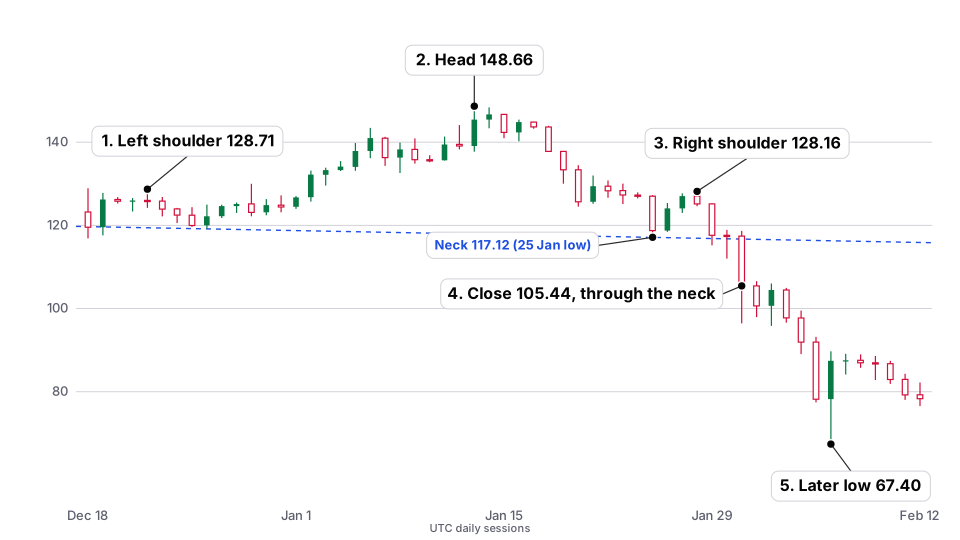
| What the setup shows | On 22 December 2025 Solana’s high was $128.71, a brief left-shoulder peak. On 26 December the low was $119.16. On the way to the head, 29 December printed a slightly higher $130.00. The head high was $148.66 on 13 January 2026 (a 6 January high of $143.43 sits on that rise). The right neck trough was $117.12 on 25 January. The right shoulder high was $128.16 on 28 January, close to the 22 December high. On 29 January the low was $115.21, already through the 25 January neck low, with a close of $117.62 back at the neck. On 31 January the low was $96.43 and the close was $105.44, clearly through the neck. |
|---|---|
| Hypothetical study logic (untested) | A study of a neckline break might treat the 31 January close of $105.44 as interest, with invalidation above that day’s high of $118.67. Planned risk would be $13.23 (1R). An illustrative 2R target would sit at $78.98. A wider stop above the right-shoulder high of $128.16 would be $22.72 of planned risk, with 2R at $60.00. Untested. The 31 January close is already $11.68 under the 25 January neck low, so a market order at that close would have paid a large part of the move. |
| What price did afterwards | On 6 February the low was $67.40 (close $87.42), through the tighter 2R figure of $78.98, and short of the wider 2R figure of $60.00. |
| What could go wrong | The left shoulder is a brief peak, and 29 December’s $130.00 high is slightly above it, so this is a looser structure than a textbook drawing with two clean, equal shoulders. The 29 January wick to $115.21 had already traded through the neck a session before the 31 January close. A later low after a close far beyond the neck is not a filled study order at the neck itself. |

Josh explains
A walkthrough of this example
This is narration of the published facts on this page. It does not add new numbers, and it is not a signal.
-

Step 1
What the chart is showing
Solana daily into early 2026: two similar shoulders around a higher head, then a close through the neck. The write-up is honest that the left shoulder is brief and that a nearby high sits slightly above it — a looser structure than a textbook drawing.
-

Step 2
The untested study idea
A hypothetical neckline-break study from the 31 January close is on the page, with tighter and wider invalidation, both untested. A wick had already traded through the neck a session earlier, so a rule has to say which break counts.
-

Step 3
What could go wrong
Head-and-shoulders drawings are easy to tighten after the fact. If the shoulders are not clean, say so, as this page does. Educational only, not a signal.
Join the lab list
Occasional notes about this public lab — new pages and implementation notes. Not signals, not a membership account, and not an application.
Education only, not financial advice. This is a personal record of one trader’s decisions, including the mistakes. Trading crypto carries a real risk of losing money. Full disclaimer.