13 / Multi-timeframe alignment (daily and 4-hour)
A daily double bottom, then a 4-hour close through the neck
BTC/USD, daily and 4-hour. Two similar daily lows, a neck at a daily high between them, and a 4-hour session that closed through that neck on the same day the daily bar closed through it. Both timeframes are shown because the alignment is the point of the example.
Educational examples — not a trade Josh took, not a signal

BTC/USD · daily+4h · 2026-07-28 to 2026-09-05. Data: Kraken public OHLC API. Fills, fees and slippage are not known from these bars. Hypothetical study figures on this page are untested.
Related glossary: multi-timeframe alignment, higher-timeframe context, breakout.
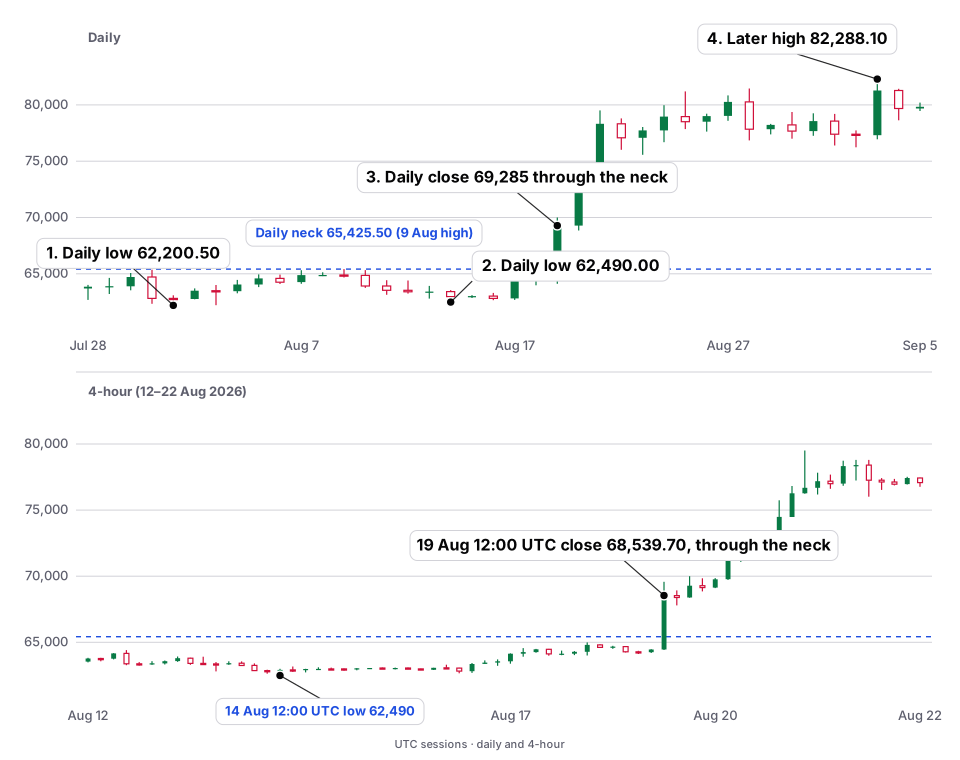
| What the setup shows | On 1 August 2026 Bitcoin’s daily low was $62,200.50; on 14 August it was $62,490.00, $289.50 apart. Between those lows, the 9 August high was $65,425.50, used here as a neck. On 17 August the daily high was $64,562.30 and on 18 August it was $64,995.20, both still below the neck (18 August low $63,985.70, close $64,677.20). On 19 August the daily bar opened at $64,677.20, high $70,001.80, low $64,115.90, close $69,285.00, through the neck. On the 4-hour chart, the 14 August 12:00 UTC bar printed the $62,490.00 low. The 19 August 12:00 UTC bar opened at $64,456.40, high $69,577.20, low $64,421.70, and closed at $68,539.70, through the same $65,425.50 neck. |
|---|---|
| Hypothetical study logic (untested) | Daily and 4-hour closes are not known fills. A study that waited for the 19 August daily close of $69,285.00 would already be $3,859.50 above the neck. From that close, invalidation below the 14 August low of $62,490.00 is $6,795.00 of planned risk (1R), and an illustrative 2R target would sit at $82,875.00. A tighter untested stop below the 18 August low of $63,985.70 would be $5,299.30 of planned risk, with 2R at $79,883.60. The 19 August 12:00 UTC 4-hour bar itself already ran from an open of $64,456.40 to a close of $68,539.70. Untested. |
| What price did afterwards | The 28 August high was $81,461.00 (close $77,841.80). The 3 September high was $82,288.10 (close $81,276.10). That 3 September high is short of the wider 2R figure of $82,875.00, and through the tighter 2R figure of $79,883.60. A later high is a description of price, not a filled study order. |
| What could go wrong | A double bottom is two similar lows, not a guarantee. The two lows here differ by $289.50, and the neck is a single session’s high, not a tested ceiling. Most of the 19 August advance happened inside that daily bar, so a rule that enters on the daily close would have paid up. Alignment on two timeframes is a reading of the same sessions, not evidence of an edge. |

Josh explains
A walkthrough of this example
This is narration of the published facts on this page. It does not add new numbers, and it is not a signal.
-

Step 1
What the chart is showing
Bitcoin, mid-2026, daily plus 4-hour: two similar lows, a neck marked at a session high, then a later close through that neck. Most of the advance on the break day happened inside that daily bar — the write-up flags that.
-

Step 2
The untested study idea
A study that waited for the 19 August daily close would already be well above the neck, with a wide stop down to the second low. Daily and 4-hour closes are not known fills. The 2R figures are illustrations and are labeled untested.
-

Step 3
What could go wrong
A double bottom is two similar lows, not a guarantee. The lows here differ by a published $289.50, and the neck is a single session’s high. A rule that enters on the daily close is buying a move that already happened inside the bar.
Join the lab list
Occasional notes about this public lab — new pages and implementation notes. Not signals, not a membership account, and not an application.
Education only, not financial advice. This is a personal record of one trader’s decisions, including the mistakes. Trading crypto carries a real risk of losing money. Full disclaimer.