14 / Failed breakout — this one did not hold
A close through a March high, then a stop that would have been hit
BTC/USD, daily. Price closed through a clearly marked swing high, then the very next sessions gave the breakout back and undercut the breakout day’s low. This is the example of a breakout that does not hold.
Educational examples — not a trade Josh took, not a signal

BTC/USD · daily · 2026-02-25 to 2026-03-28. Data: Kraken public OHLC API. Fills, fees and slippage are not known from these bars. Hypothetical study figures on this page are untested.
Related glossary: failed breakout, breakout, invalidation.
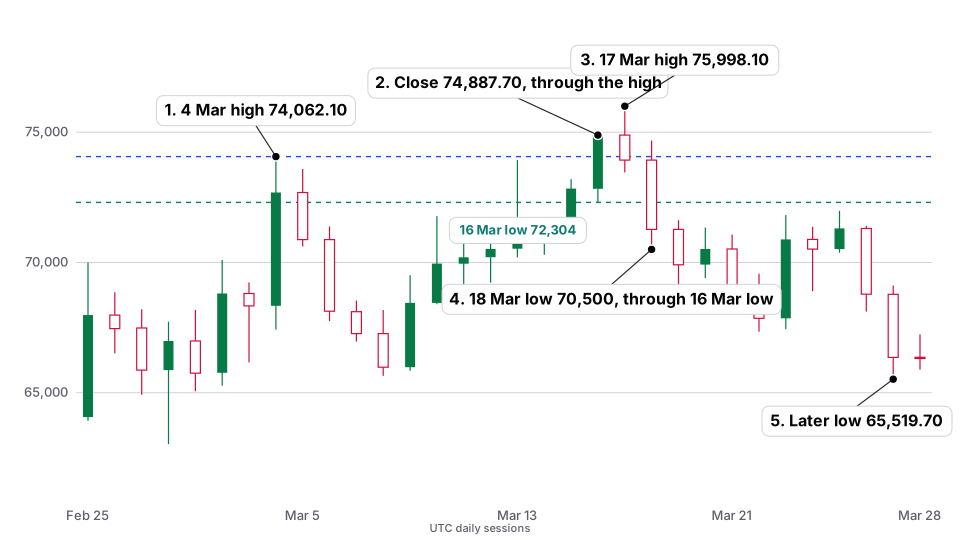
| What the setup shows | On 4 March 2026 Bitcoin’s high was $74,062.10 (close $72,684.80). A nearby 13 March high was $73,928.50. On 16 March it closed at $74,887.70, through the 4 March high, after a low that day of $72,304.00 (high $74,901.30). On 17 March the high was $75,998.10 and the close was $73,929.90, already back below the 4 March high. On 18 March the low was $70,500.00 (close $71,270.90), through the 16 March low. |
|---|---|
| Hypothetical study logic (untested) | A study of a “buy a close through the 4 March high” might treat the 16 March close of $74,887.70 as interest, with invalidation below that day’s low of $72,304.00. Planned risk would be $2,583.70 (1R). An illustrative 2R target would sit at $80,055.10. Untested, and a daily close is not a known fill. |
| What price did afterwards | The 17 March high of $75,998.10 was $1,110.40 above the 16 March close, about 0.43R, and that session already closed back at $73,929.90. On 18 March the low of $70,500.00 undercut the untested $72,304.00 stop. The 2R figure of $80,055.10 was not reached in this window. On 27 March the low was $65,519.70 (close $66,358.30). |
| What could go wrong | Exactly this: a close through a swing high can fail immediately. The 17 March close back under the 4 March high was already a warning, and the 18 March low would have hit a stop under the 16 March low. Seeing only the 17 March high without also recording the stop-out would be cherry-picking. A single failed breakout is not a sample and is not an edge for fading breakouts either. |

Josh explains
A walkthrough of this example
This is narration of the published facts on this page. It does not add new numbers, and it is not a signal.
-

Step 1
What the chart is showing
Bitcoin daily, March 2026: a close through a prior high, then a stop in this untested study that would have been hit. This page is here because the breakout failed. Read the 16 March close, the 17 March close back under the high, and the 18 March low that undercut the untested stop.
-

Step 2
The untested study idea
A “buy a close through the high” sketch is on the page, labeled untested. The later 2R figure was not reached in this window. The 17 March high, taken alone, would have looked fine. The close and the next low tell the rest.
-

Step 3
What to take from it
Exactly this: a close through a swing high can fail immediately. Seeing only the favorable high without also recording the stop being hit is how a failed breakout becomes a success story. I want this example next to the ones that held.
Join the lab list
Occasional notes about this public lab — new pages and implementation notes. Not signals, not a membership account, and not an application.
Education only, not financial advice. This is a personal record of one trader’s decisions, including the mistakes. Trading crypto carries a real risk of losing money. Full disclaimer.