15 / Inside-bar breakout
Several inside bars, a wick through the mother low, then a close through the high
SOL/USD, daily. A wide mother bar is followed by three inside sessions. The first excursion is a wick through the mother low, with a close that still holds above it; the close through the mother high comes two sessions later.
Educational examples — not a trade Josh took, not a signal
SOL/USD · daily · 2025-01-05 to 2025-01-25. Data: Kraken public OHLC API. Fills, fees and slippage are not known from these bars. Hypothetical study figures on this page are untested.
Related glossary: inside bar, breakout, wick.
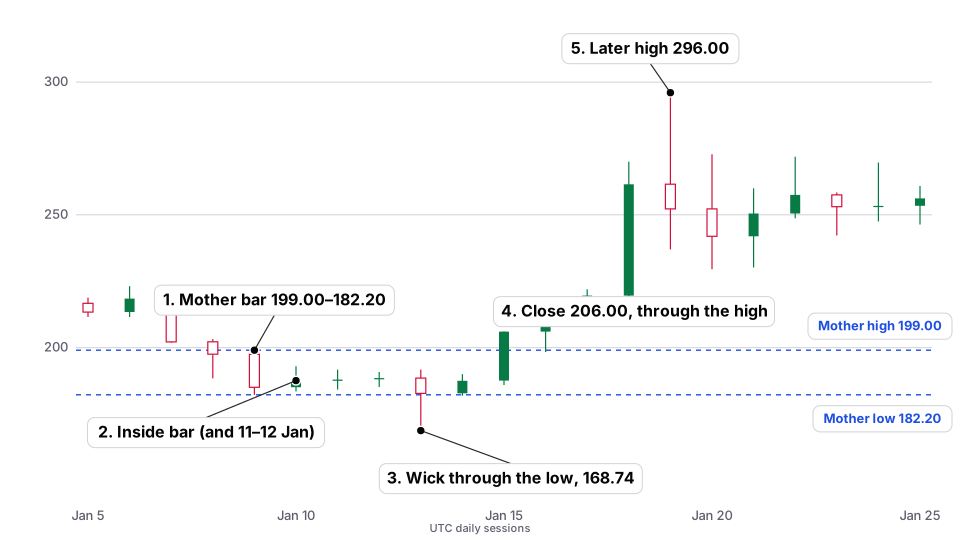
| What the setup shows | On 9 January 2025 Solana printed a wide down candle: open $197.48, high $199.00, low $182.20, close $185.06. The next three sessions were inside that mother range: 10 January high $192.97 / low $183.46, 11 January $191.69 / $184.17, and 12 January $190.79 / $185.16. On 13 January the low was $168.74, through the mother low of $182.20, and the close was $182.73, still just above it. On 14 January the low was $181.83, slightly under the mother low, close $187.49. On 15 January the close was $206.00 (high $206.00), through the mother high of $199.00. |
|---|---|
| Hypothetical study logic (untested) | A study of an upside inside-bar break might treat the 15 January close of $206.00 as interest. Invalidation below the 13 January wick of $168.74 would be $37.26 of planned risk (1R), with an illustrative 2R at $280.52 — a wide stop. A tighter untested stop below the mother low of $182.20 would be $23.80 of planned risk, with 2R at $253.60. Untested, and a daily close is not a known fill. The 13 January downside wick happened before this hypothetical entry. |
| What price did afterwards | On 18 January the high was $270.00 (close $261.51), already through the tighter 2R figure. On 19 January the high was $296.00 (close $252.22), through the wider 2R figure of $280.52 as well. |
| What could go wrong | This is not a single neat inside bar with an immediate close-break. Three inside sessions, then a wick through the mother low, then a close through the high two days later, is a messier sequence than the textbook drawing. A rule that takes the first close outside the mother bar would have had to decide what the 13 January close of $182.73, still above the mother low, counted as. A later high is not proof the shape has an edge. |

Josh explains
A walkthrough of this example
This is narration of the published facts on this page. It does not add new numbers, and it is not a signal.
-

Step 1
What the chart is showing
Solana daily, January 2025: a wide mother bar, three inside sessions, a wick through the mother low, then a later close through the high. The write-up calls this messier than the textbook drawing — that’s the point.
-

Step 2
The untested study idea
A hypothetical upside break from the 15 January close has both a wide stop under the wick and a tighter stop under the mother low, both untested. Later highs in the window ran through the illustrative 2R figures. A daily close is still not a known fill.
-

Step 3
What could go wrong
A rule that takes the first probe, or that assumes one neat inside bar, would have had to decide what to do on the wick through the low. Textbook shapes rarely arrive as clean as the diagram.
Join the lab list
Occasional notes about this public lab — new pages and implementation notes. Not signals, not a membership account, and not an application.
Education only, not financial advice. This is a personal record of one trader’s decisions, including the mistakes. Trading crypto carries a real risk of losing money. Full disclaimer.