11 / Evening star
A three-candle evening star, then a later decline — and a bounce
BTC/USD, daily. A long up candle, a small-bodied star with a long upper wick, and a third candle whose close sits just under the first candle’s midpoint. The pattern is close to the textbook drawing, not a perfect copy of it.
Educational examples — not a trade Josh took, not a signal

BTC/USD · daily · 2025-10-18 to 2025-11-10. Data: Kraken public OHLC API. Fills, fees and slippage are not known from these bars. Hypothetical study figures on this page are untested.
Related glossary: evening star, candle confirmation, wick.
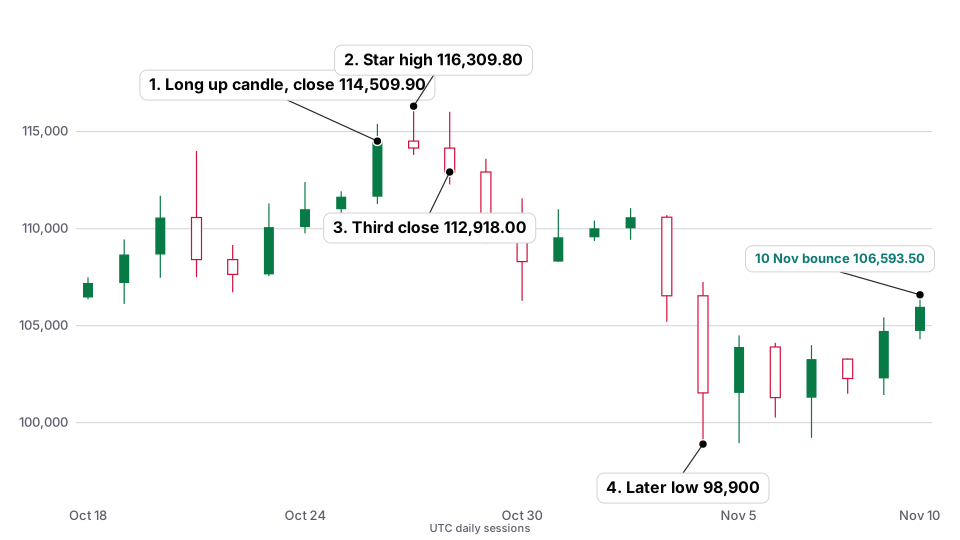
| What the setup shows | On 26 October 2025 Bitcoin opened at $111,645.20, high $115,400.00, low $111,274.30, close $114,509.90. The midpoint of that body is $113,077.55. On 27 October the star opened at $114,510.00, high $116,309.80, low $113,801.40, close $114,153.00. The body is 0.31% of the open, and the upper wick is about 72% of the day’s range. On 28 October it opened at $114,153.10, wicked up to $116,023.40 (near the star high), and closed at $112,918.00 — just under the first candle’s midpoint of $113,077.55, by $159.55. |
|---|---|
| Hypothetical study logic (untested) | A study of an evening-star short might treat the 28 October close of $112,918.00 as interest, with invalidation above the star high of $116,309.80. Planned risk would be $3,391.80 (1R). An illustrative 2R target would sit at $106,134.40. Untested, and a daily close is not a known fill. The third close only just undercuts the first-body midpoint, and that same session wicked back to $116,023.40. |
| What price did afterwards | On 4 November the low was $98,900.00 (close $101,537.30), through the 2R figure. Price then bounced: the 10 November high was $106,593.50 (close $105,973.30), back through that 2R figure, but still well under the 27 October star high of $116,309.80. |
| What could go wrong | The third candle’s wick to $116,023.40 came close to the untested stop at $116,309.80. A slightly longer wick would have tagged it. A later bounce can give back a large part of the decline, as 10 November shows. An evening star is a three-candle description, not a complete trade rule. |

Josh explains
A walkthrough of this example
This is narration of the published facts on this page. It does not add new numbers, and it is not a signal.
-

Step 1
What the chart is showing
Bitcoin daily, late October 2025: a three-candle evening-star shape, then a later decline, and then a bounce. The write-up includes both the decline through an illustrative 2R figure and the later bounce back through it. That bounce is part of the lesson.
-

Step 2
The untested study idea
A hypothetical short from the third close, invalidation above the star high, is labeled untested. The third candle’s wick already came close to that untested stop.
-

Step 3
What could go wrong
A slightly longer wick would have tagged the stop. A later bounce can give back a large part of the decline, as 10 November shows in the write-up. An evening star is a three-candle description, not a promise of a trend change.
Join the lab list
Occasional notes about this public lab — new pages and implementation notes. Not signals, not a membership account, and not an application.
Education only, not financial advice. This is a personal record of one trader’s decisions, including the mistakes. Trading crypto carries a real risk of losing money. Full disclaimer.