10 / Order block / demand zone
The last down candle before a displacement, then a return
SOL/USD, daily. The last down candle before a bullish displacement is marked as a demand zone. Price later came back into that zone and then moved up. The displacement candle itself already wicked into the zone.
Educational examples — not a trade Josh took, not a signal

SOL/USD · daily · 2025-04-11 to 2025-05-02. Data: Kraken public OHLC API. Fills, fees and slippage are not known from these bars. Hypothetical study figures on this page are untested.
Related glossary: order block, supply and demand zone, displacement.
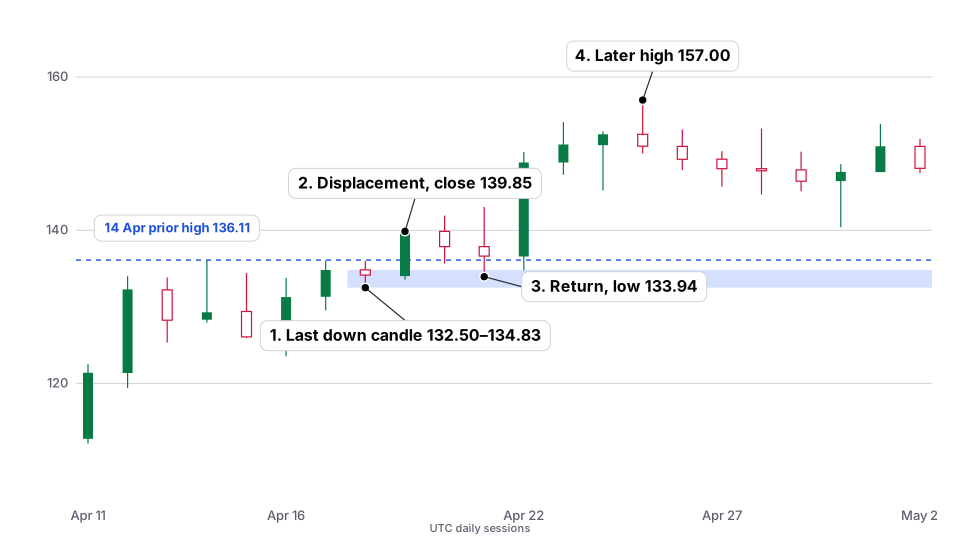
| What the setup shows | On 18 April 2025 Solana printed the last down candle before the impulse: open $134.83, high $135.99, low $132.50, close $134.15, a zone of $132.50–$134.83. On 19 April a displacement session opened at $134.01, wicked to $133.56 (already inside that zone), and closed at $139.85, through the 14 April prior high of $136.11. On 21 April price returned: low $133.94, still inside the zone, close $136.63. |
|---|---|
| Hypothetical study logic (untested) | A study of a demand-zone return might treat the 21 April close of $136.63 as interest, with invalidation below the 18 April zone low of $132.50. Planned risk would be $4.13 (1R). An illustrative 2R target would sit at $144.89. Untested, and a daily close is not a known fill. The 19 April displacement low of $133.56 had already tagged the zone on the impulse day itself. |
| What price did afterwards | On 22 April the low was $134.79, still above the zone low, and the close was $148.85, already through the 2R figure. The 25 April high was $157.00 (close $150.98). In the rest of this window, later lows stayed above $132.50; the 30 April low was $140.40. |
| What could go wrong | A return to a marked zone can fail and close through the low. Zones are areas, not precise tripwires. A close already through a 2R figure on the next session also means a market order at the 21 April close would have captured only part of the later range, and only if a fill existed at that close. |

Josh explains
A walkthrough of this example
This is narration of the published facts on this page. It does not add new numbers, and it is not a signal.
-

Step 1
What the chart is showing
Solana daily, April 2025: the last down candle before a displacement is marked as a zone, price comes back into that zone, and later sessions in this window stay above the zone low. Zones are areas, not precise tripwires — the write-up says so.
-

Step 2
The untested study idea
A hypothetical “demand-zone return” from the 21 April close is on the page, with invalidation below the zone low, labeled untested. A daily close is not a known fill, and a later close already through an illustrative 2R figure does not mean you would have been filled at the close.
-

Step 3
What could go wrong
A return to a marked zone can fail and close through the low. This is education, not a signal, and not a trade I took.
Join the lab list
Occasional notes about this public lab — new pages and implementation notes. Not signals, not a membership account, and not an application.
Education only, not financial advice. This is a personal record of one trader’s decisions, including the mistakes. Trading crypto carries a real risk of losing money. Full disclaimer.