01 / Support and resistance
A broken high tried as support
A prior high on Bitcoin daily that later traded as support. Educational only.
Educational examples — not a trade Josh took, not a signal

BTC/USD · daily · 2025-05-16 to 2025-08-16. Data: Kraken public OHLC API. Fills, fees and slippage are not known from these bars. Hypothetical study figures on this page are untested.
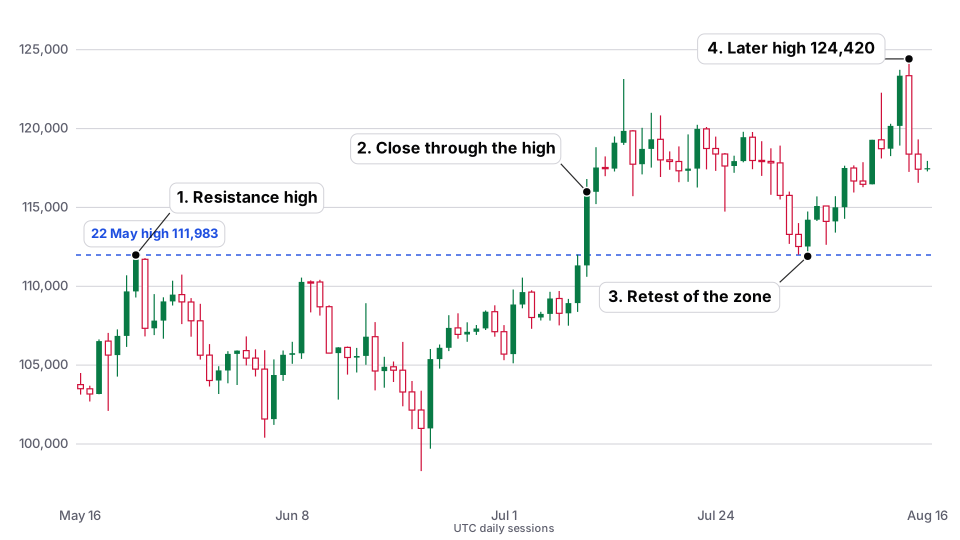
The full write-up, including the hypothetical study logic and what happened afterwards, is on the technical examples page. The published facts for this chart are:
| resistanceHigh.date | 2025-05-22 |
|---|---|
| resistanceHigh.h | 111983.2 |
| resistanceHigh.c | 111711.1 |
| breakClose.date | 2025-07-10 |
| breakClose.h | 116800 |
| breakClose.c | 115990.2 |
| retest.date | 2025-08-03 |
| retest.l | 111897.1 |
| retest.c | 114224.1 |
| retestAug1.date | 2025-08-01 |
| retestAug1.l | 112688.1 |
| retestAug1.c | 113290.2 |
| retestAug2.date | 2025-08-02 |
| retestAug2.l | 112000 |
| retestAug2.c | 112525.2 |
| laterHigh.date | 2025-08-14 |
| laterHigh.h | 124420 |
| laterHigh.c | 118383.1 |
| laterAug19.date | 2025-08-19 |
| laterAug19.c | 112830.3 |
| laterAug19.l | 112750 |
Josh explains
A walkthrough of this example
This is narration of the published facts on this page. It does not add new numbers, and it is not a signal.
-

Step 1
What the chart is showing
On Bitcoin daily, a prior high around 22 May 2025 later comes back into the picture after a July close through that area. In August, price trades back toward that old high and holds above it on the closes in this window. That’s a common “old resistance tried as support” picture — a description of these bars, not a rule with an edge.
-

Step 2
How to read it as a student
Ask: did the break close through the prior high, and did the later test stay on this side of it? The published facts mark the May high, the 10 July close, and the early-August retest lows. Walk those three dates on the chart before you invent a story around them.
-

Step 3
What to keep honest
This is an educational example from public Kraken daily bars, not a trade I took and not a signal. A hold in this window does not mean the same shape will hold next time. Fills, fees and slippage are not known from these closes.
Join the lab list
Occasional notes about this public lab — new pages and implementation notes. Not signals, not a membership account, and not an application.
Education only, not financial advice. This is a personal record of one trader’s decisions, including the mistakes. Trading crypto carries a real risk of losing money. Full disclaimer.