07 / Change of character and break of structure
A higher-high sequence, then a close under the last higher low
ETH/USD, daily. After a short run of higher highs and higher lows, a rejection high is followed by a close under the last higher low — a change of character — and then a further break of structure.
Educational examples — not a trade Josh took, not a signal

ETH/USD · daily · 2025-02-05 to 2025-03-10. Data: Kraken public OHLC API. Fills, fees and slippage are not known from these bars. Hypothetical study figures on this page are untested.
Related glossary: change of character, break of structure, higher highs and higher lows, shooting star.
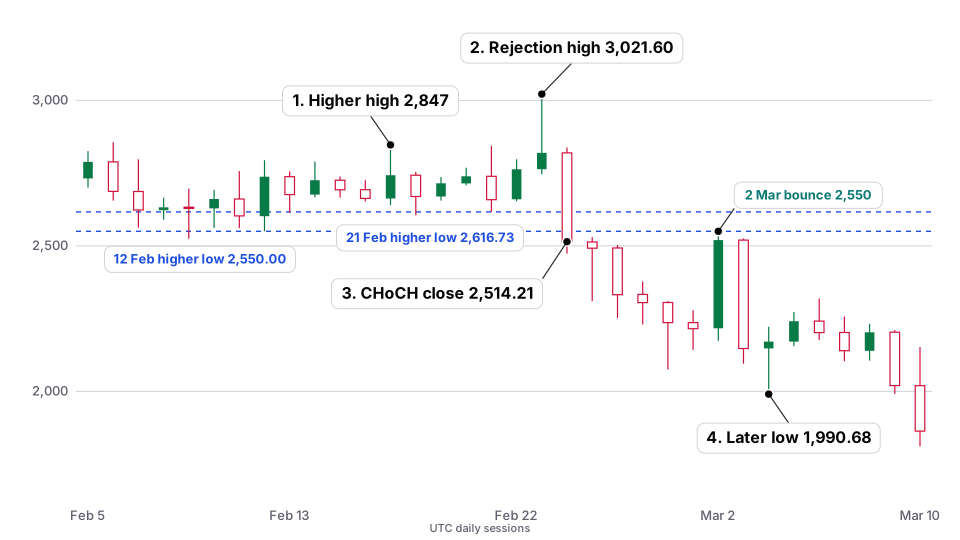
| What the setup shows | From 9–23 February 2025 Ether made higher lows (9 February $2,524.70, 12 February $2,550.00, 18 February $2,605.12, 21 February $2,616.73) and higher highs (17 February $2,847.00, then 23 February $3,021.60). The 23 February session had a long upper wick: high $3,021.60, close $2,819.49, with the upper wick about 73% of the day’s range. On 24 February it opened at $2,819.49, traded down to $2,473.34, and closed at $2,514.21 — under the 21 February higher low of $2,616.73. On 25 February the low was $2,309.99 (close $2,491.74), a further break of structure. |
|---|---|
| Hypothetical study logic (untested) | A study of a CHoCH short might treat the 24 February close of $2,514.21 as interest, with invalidation above that day’s high of $2,838.33. Planned risk would be $324.12 (1R). An illustrative 2R target would sit at $1,865.97. A wider stop above the 23 February high of $3,021.60 would be $507.39 of planned risk. Untested, and a daily close is not a known fill. |
| What price did afterwards | On 2 March price bounced: high $2,550.00, close $2,519.77, still below the 24 February high. On 3 March it sold off again (low $2,095.00, close $2,147.28). The 4 March low was $1,990.68, short of the tighter 2R figure. On 10 March the low was $1,810.66 and the close was $1,863.51, through that 2R figure on the low, just under it on the close. |
| What could go wrong | The 2 March bounce to $2,550.00 would have been an uncomfortable move against a short that was still inside the untested stop. A change of character is a description of a close under a prior higher low, not a promise of a trend change. Daily bars also hide gaps and slippage through a stop. |

Josh explains
A walkthrough of this example
This is narration of the published facts on this page. It does not add new numbers, and it is not a signal.
-

Step 1
What the chart is showing
Ether daily, February 2025: a run of higher lows and higher highs, then a 24 February close under the last higher low. The published write-up walks the dates and prices. A change of character, in that language, is a description of that close — not a forecast.
-

Step 2
The untested study idea
The page already sketches a hypothetical short from the 24 February close, with invalidation above that day’s high, and it labels the idea untested. A daily close is not a known fill. Planned risk and 2R figures on the page are illustrations, not my results.
-

Step 3
What happened afterward
Price bounced on 2 March, still below the 24 February high, then sold off again. The 4 March low was short of the tighter 2R figure. Later in the window, the 10 March low ran further. That’s a description of this sample of bars, not a completed test.
-

Step 4
What could go wrong
The 2 March bounce would have been an uncomfortable move against a short that was still inside the untested stop. A change of character is not a promise of a trend change. Compare this page with the failed CHoCH example — same idea, different outcome.
Join the lab list
Occasional notes about this public lab — new pages and implementation notes. Not signals, not a membership account, and not an application.
Education only, not financial advice. This is a personal record of one trader’s decisions, including the mistakes. Trading crypto carries a real risk of losing money. Full disclaimer.