04 / RSI divergence
A lower price low with a higher RSI low
A lower price low with a higher RSI low on Bitcoin daily. Educational only.
Educational examples — not a trade Josh took, not a signal

BTC/USD · daily · 2025-02-20 to 2025-03-28. Data: Kraken public OHLC API. Fills, fees and slippage are not known from these bars. Hypothetical study figures on this page are untested.
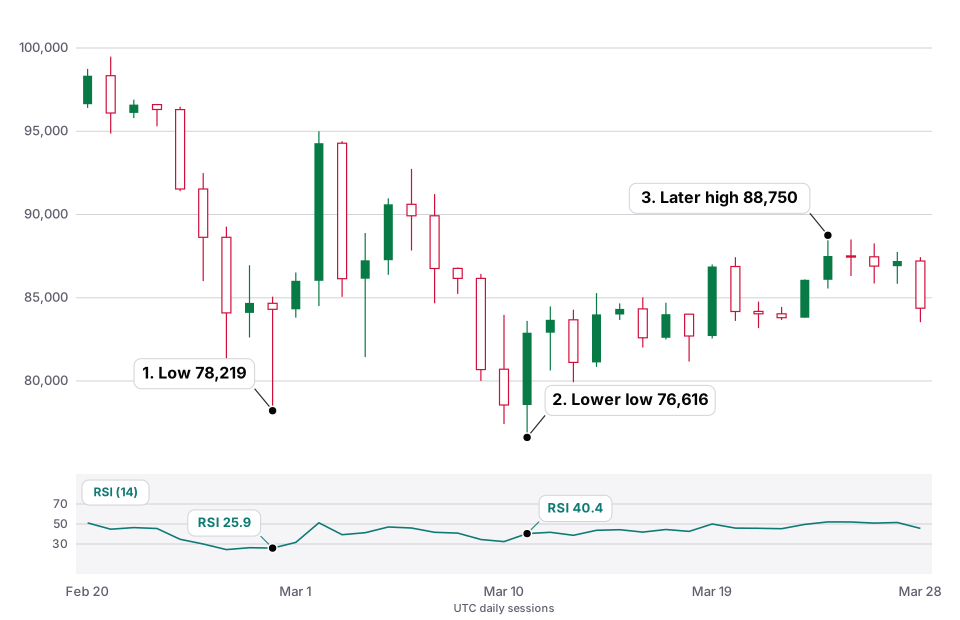
The full write-up, including the hypothetical study logic and what happened afterwards, is on the technical examples page. The published facts for this chart are:
| low1.date | 2025-02-28 |
|---|---|
| low1.l | 78219 |
| low1.c | 84309.2 |
| low1.rsi | 25.89095387931239 |
| low2.date | 2025-03-11 |
| low2.l | 76615.7 |
| low2.c | 82900 |
| low2.rsi | 40.414410915728105 |
| mar13.date | 2025-03-13 |
| mar13.l | 79930.7 |
| mar13.c | 81112.3 |
| laterHigh.date | 2025-03-24 |
| laterHigh.h | 88750 |
| laterHigh.c | 87505.3 |
| mar31.date | 2025-03-31 |
| mar31.l | 81270.3 |
| mar31.c | 82523 |

Josh explains
A walkthrough of this example
This is narration of the published facts on this page. It does not add new numbers, and it is not a signal.
-

Step 1
What the chart is showing
Bitcoin daily: a 28 February 2025 low of $78,219.00 with a published RSI near 25.9, then an 11 March low of $76,615.70 — a lower price low — with a higher RSI near 40.4. That’s the textbook “lower low, higher oscillator low” picture in this window.
-

Step 2
How to read it as a student
Divergence is a relationship between price and an indicator on these bars. It does not make a turn due. Look at what price actually did after the second low, and remember RSI is a derived series, not a second market.
-

Step 3
What to keep honest
Indicators can stay “diverged” while price keeps going. This example is education, not a signal, and not a trade I took. No implied edge.
Join the lab list
Occasional notes about this public lab — new pages and implementation notes. Not signals, not a membership account, and not an application.
Education only, not financial advice. This is a personal record of one trader’s decisions, including the mistakes. Trading crypto carries a real risk of losing money. Full disclaimer.